News Story
Maryland Deploys first-in-the-nation “all-modes” operations dashboard
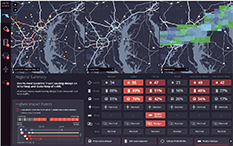
An initiative of the Secretary’s office, state of Maryland deployed a multi-modal operations dashboard that ties together Maryland airport, transit, port, and roadway incident and congestion data. The goal of the dashboard is to give modal administrators insights into the real-time conditions of their facilities, but also to show the linkages between modes. For example, the dashboard not only shows maritime traffic congestion (ships at births, ships waiting, etc.), but also shows whether the roads leading into or out of the ports are more congested than typical (and by how much). Similarly, transit operators can see how many routes are running early, late, or on-time, and where there are collisions along bus routes that may be impacting on-time performance. While this is only the first phase of deployment, the dashboard has already received praise from other transportation officials during national webinars as a first-in-the-nation capability that others now want to emulate. The dashboard was developed by the CATT Laboratory as part of the RITIS Platform under the guidance and direction of the Secretary’s office, modal administrators, and Jason Dicembre of the SHA CHART Program.
November 24, 2020 Prev Next |


